Win Rate Is the Worst Metric for Judging Strategies

On this page
A strategy wins nine times out of ten. Would you put your money into it?
Most investors hear “90% win rate” and assume they’re looking at something exceptional. I understand why. Winning feels good, losing feels bad, and a strategy that’s right most of the time sounds safer than one that loses more often.
But win rate is the worst headline metric for judging a strategy. It counts how often the number was positive while ignoring how much money you made, how much you lost, and how much risk you took to get there.
You can be right 90% of the time and still lose money. You can also be wrong most of the time and come out well ahead.
Let’s prove it.
A 90% win rate can still lose money
Start with $100,000 and compare two strategies across ten equal periods. There are no deposits, withdrawals, or costs in either account.
Strategy A wins 90% of the time. It gains 2% in nine periods and loses 25% in one period.
Win rate: 9 out of 10, or 90%
Typical gain: 2%
Loss: 25%
Average result per period: (9 × 2% - 25%) ÷ 10 = -0.7%
Compounded ending value: $100,000 × 1.02⁹ × 0.75 = $89,632
Strategy B wins 40% of the time. It gains 12% in four periods and loses 4% in six periods.
Win rate: 4 out of 10, or 40%
Typical gain: 12%
Typical loss: 4%
Average result per period: (4 × 12% - 6 × 4%) ÷ 10 = 2.4%
Compounded ending value: $100,000 × 1.12⁴ × 0.96⁶ = $123,168
Strategy A gave you the emotional reward of being right almost every time and left you down $10,368. Strategy B made you sit through more losing periods than winning ones and left you up $23,168.
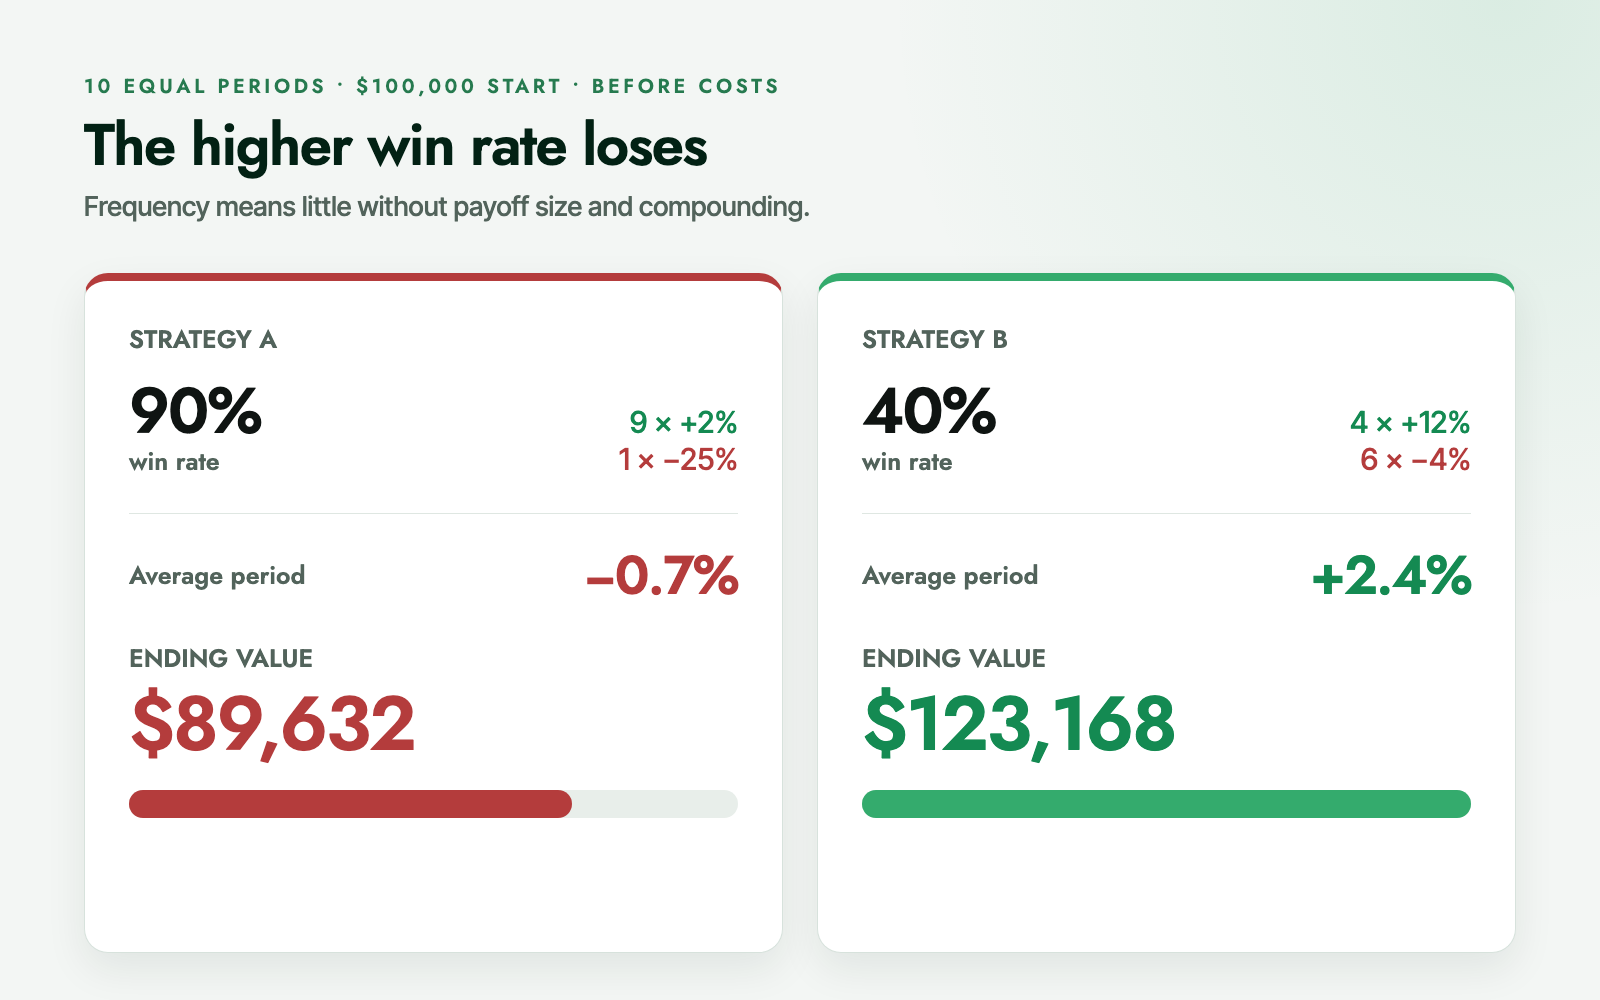
That is why win rate is such a bad starting point. It answers the question, “How often did I feel right?” The question your portfolio needs answered is, “What happened to my money?”
Payoff size is what win rate leaves out
Every strategy has two separate parts:
- How often it wins and loses
- How much it makes when it wins compared with how much it loses when it loses
Win rate gives you the first part and throws away the second.
A quick way to put them back together is:
Average outcome = (win rate × average gain) - (loss rate × average loss)
For Strategy A, that’s:
(90% × 2%) - (10% × 25%) = -0.7% per period
The 90% win rate looks brilliant on its own. Once we include the size of the wins and losses, the strategy loses money on average.
We can also turn the same idea around and calculate the break-even win rate:
Break-even win rate = average loss ÷ (average gain + average loss)
With 2% gains and 25% losses, Strategy A needs to win more than 92.6% of the time just to break even before costs and taxes. A 90% win rate isn’t high enough.
Strategy B only needs to win 25% of the time because its average gain is three times its average loss. Its 40% win rate gives it room above that break-even point.
Position size belongs in this calculation too. A 10% gain on $10,000 makes $1,000. A 2% loss on $100,000 loses $2,000. One win and one loss produce a 50% win rate, but the account is down $1,000.
This doesn’t make a low win rate automatically good. A 20% win rate with tiny gains and huge losses would be awful. The point is that no win-rate percentage means anything until you connect it to the payoffs.
A big loss does more damage than it appears
Losses also change the amount of money available to recover.
If your $100,000 account falls 25%, you lose $25,000 and have $75,000 left. A 25% gain from there only adds $18,750, taking you to $93,750. Getting all the way back to $100,000 requires a 33.3% gain.
A 50% loss is harsher. Your $100,000 becomes $50,000, so you need a 100% gain to recover.
The recovery percentage rises faster because every new gain is working on a smaller base. A win-rate figure can’t show you that damage.
It also can’t show you the path. In Strategy A, nine gains in a row would grow the account to $119,509. The one 25% loss would then knock it down to $89,632. Someone watching that account would experience a $29,877 fall from its peak even though the strategy could still advertise nine wins out of ten.
Strategy B has a different problem. If its six losing periods arrived first, the account would fall to about $78,276 before the four gains carried it to $123,168. The ending result is strong, but you would have needed the patience and financial ability to stay with it through a 21.7% decline.
That path matters when you may need the money, when losses could force you to reduce the position, or when the decline is larger than you can actually tolerate. “It wins a lot” tells you nothing about those questions.
The safest-looking number can hide the ugliest risk
A strategy with frequent small gains and rare large losses has negative skew. In plain language, most results look pleasant, but the bad result can be severe.
That structure can make a strategy look unusually consistent right before the large loss arrives. A short record may contain dozens of small wins and no example of the event that does the real damage. Even a long record can mislead you if market conditions changed and the strategy’s worst environment hasn’t appeared often enough to measure well.
There’s another problem with averages: losses can cluster. Six 4% losses spread across several years may be manageable. Six of them in a row create a very different experience, even though the win rate and average loss are unchanged.
So I want to know more than the largest recorded loss. I want to understand what creates the loss, whether several positions can fail for the same reason, how much of the portfolio is exposed, and what happens if the difficult period lasts longer than it did before.
Translate that risk into dollars. A 25% loss on 5% of a $100,000 portfolio costs $1,250. The same loss on the whole portfolio costs $25,000. Counting each as one losing observation erases the difference that matters most.
You can change the win rate without changing the result
Win rate sounds objective until you ask what counts as a win.
Are we counting trades, days, months, years, closed positions, or individual purchases? Are a $1,000 position and a $100,000 position each one observation? If a position is bought in three pieces and sold together, is that one trade or three?
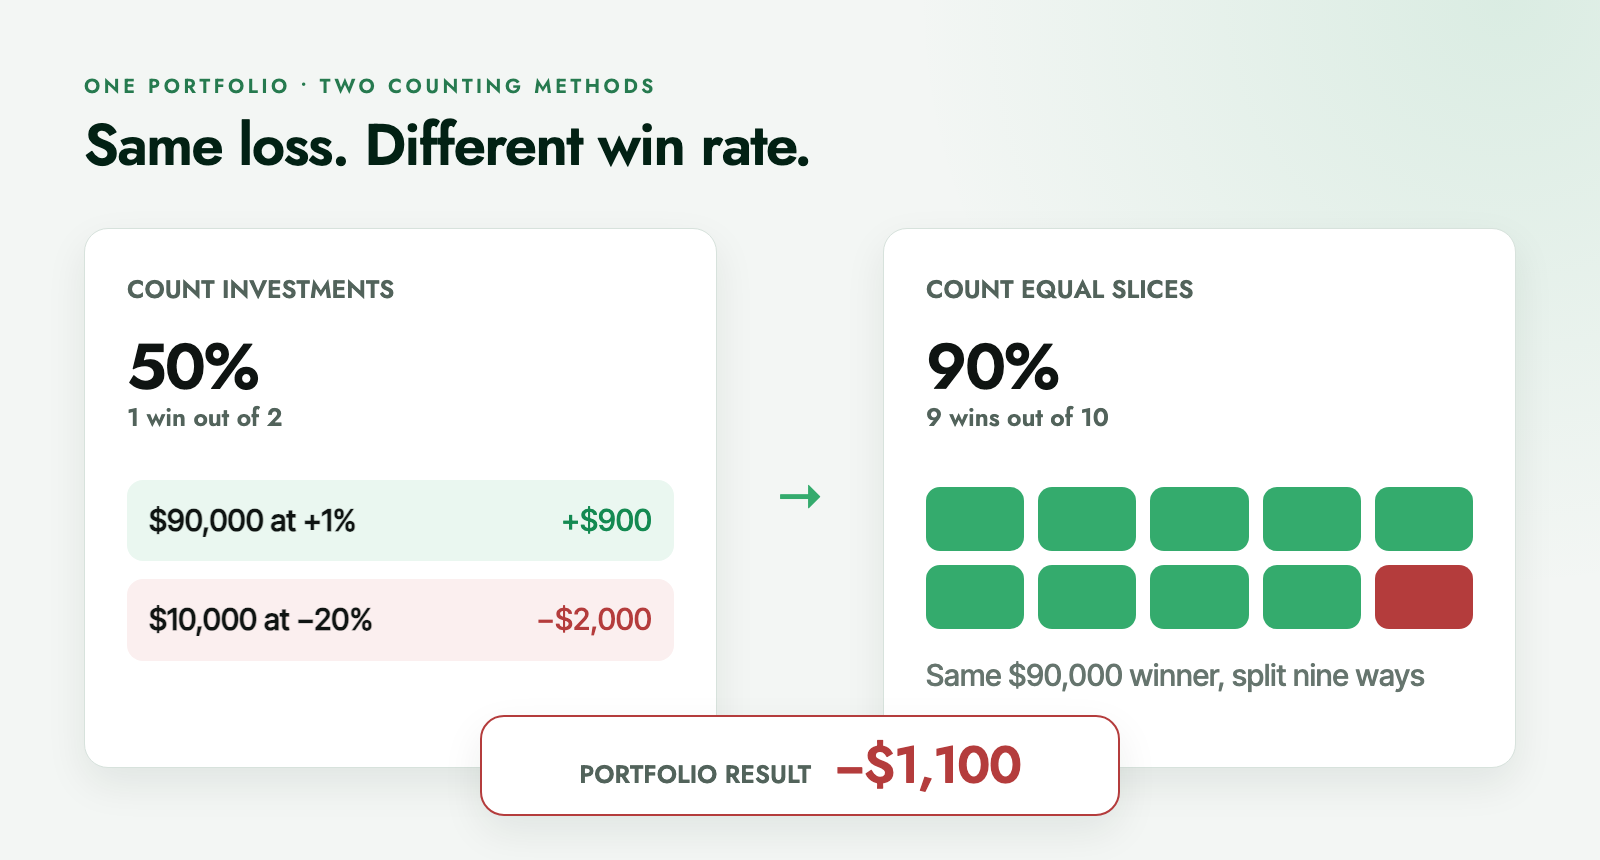
Here’s how silly this can get. Put $90,000 into one investment that gains 1% and $10,000 into another that loses 20%.
The first makes $900. The second loses $2,000. Your portfolio loses $1,100, or 1.1%.
Count the two investments and the win rate is 50%.
Now split the $90,000 into nine separate $10,000 positions, with each one gaining the same 1%. Keep the losing position exactly as it was. You now have nine wins and one loss, so the win rate jumps to 90%.
Your portfolio still loses the same $1,100.
Nothing improved except the counting method. That is why a win rate without a consistent observation, position size, time period, and treatment of partial entries or exits is barely a metric at all.
Replace win rate with a scorecard that follows the money
No single number can tell you whether a strategy deserves your money. But there is a sensible order for the work.
1. Start with compounded return. Look at what happened to the capital after gains and losses worked on one another. Use the same dates, deposits, withdrawals, and assumptions when comparing the strategy with an alternative.
2. Examine the full payoff profile. Check the average and median gain, average and median loss, largest gains and losses, and how much of the total result came from a handful of periods or positions. You’re looking for what actually produced the return.
3. Study drawdowns and recovery. How far did the strategy fall from a previous peak? How long did it take to recover? Could you have stayed invested through that decline without needing the money or abandoning the process?
4. Identify the risk and benchmark. Compare the strategy with something you could reasonably have owned instead. Then ask whether the extra return came from a repeatable advantage or simply from taking more market, sector, concentration, or borrowing risk.
5. Subtract the real costs. Include trading costs, fund expenses, research bills, taxes where relevant, and the effect of not being able to trade at the recorded price. The SEC’s Investor.gov guide to investment fees makes the central point clearly: fees reduce the money in your portfolio that can keep compounding.
6. Judge the evidence. How many observations do you have? Do they cover different market conditions? Were the rules set before the results were known? Can the strategy still be implemented with realistic prices, liquidity, and position sizes?
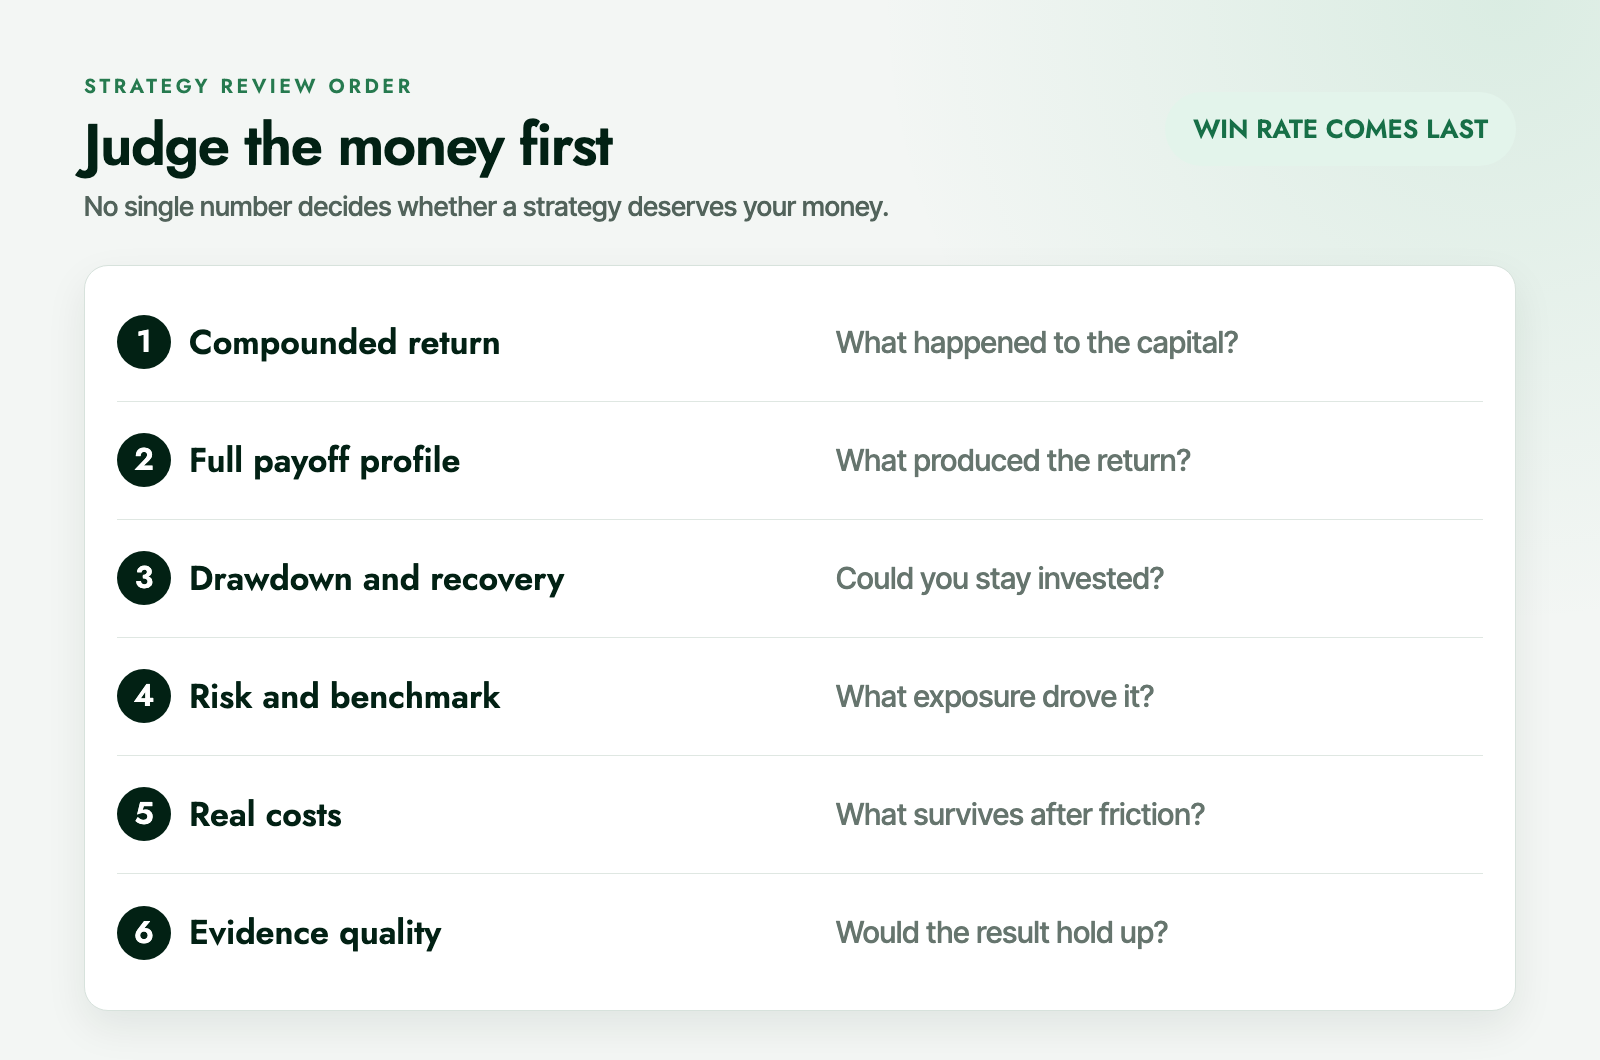
Only after those questions do I care about win rate. At that point, it can help explain how a strategy behaves. A lower win rate may require more patience. A sudden change in win rate may reveal that execution or market conditions have changed. It can be useful when observations are defined consistently and viewed alongside the actual payoffs.
If you want a clearer way to think about what really drives a portfolio, I walk through my approach in my free book, The 5-Minute Hedge Fund.
Win rate belongs at the bottom
Win rate is seductive because it gives us a simple score for how often we were right. But investing doesn’t pay us for being right frequently. It pays us according to how much money we make when we’re right, how much we lose when we’re wrong, and how much capital we put behind each outcome.
A 90% win rate can lose money. A 40% win rate can build wealth. Either one can hide risks that the historical record hasn’t prepared you to handle.
So don’t lead with win rate when someone shows you a strategy. Start with the compounded result. Follow the gains, losses, drawdowns, costs, exposures, and evidence. Then, if you still find it useful, look at win rate last.
Hey, I'm Sean. I run Predicting Alpha, where I help people beat the market without turning it into a second job. I've helped 3,000 traders, and I write these articles to explain what matters for your portfolio in plain language.
If you found this useful, follow along. I share more like this here.
P.S. I reply to all comments personally, so feel free to leave your questions below.