The Average Return You See May Not Be the Return You Earn


On this page
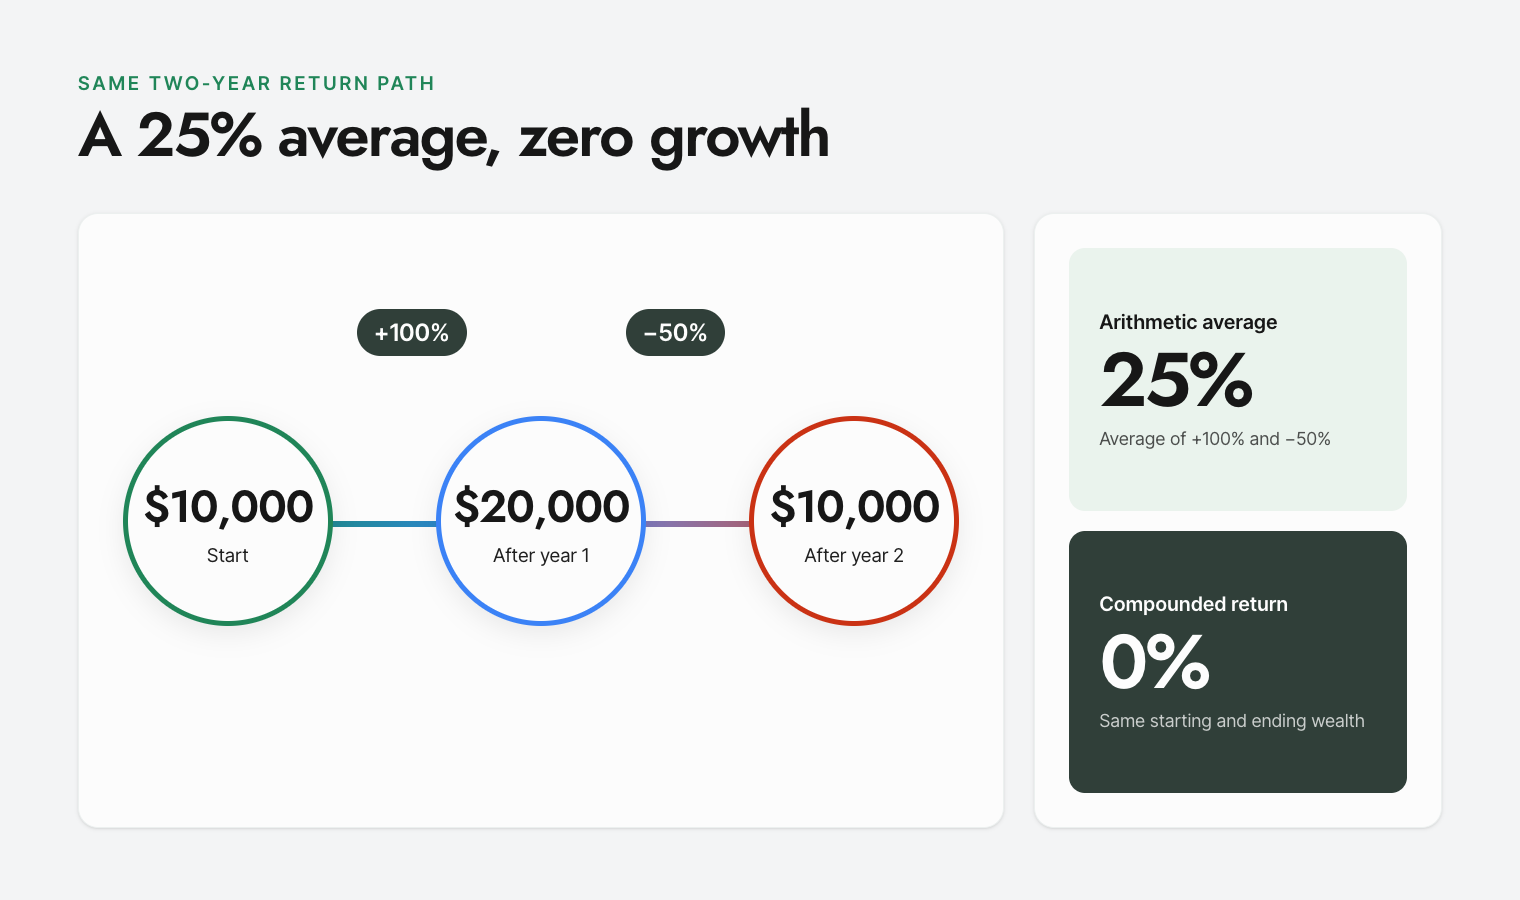
I want to show you how one investment can have a 25% average annual return while producing no growth at all.
Say I invest $10,000. In year one, the investment gains 100%, so I now have $20,000. In year two, it loses 50%, taking me right back to $10,000.
If I add the two annual returns together and divide by two, I get an average return of 25%:
(100% + -50%) / 2 = 25%
That calculation is correct. My wealth still compounded at 0% per year because I started and finished with the same $10,000.
Both numbers accurately describe the same two years. They answer different questions, and confusing those questions can give you a badly distorted view of an investment's performance.
One return path, two different answers
Most of us hear “25% average annual return” and picture money growing by roughly 25% a year. That would turn $10,000 into $15,625 after two years.
Our investment did something very different. It went from $10,000 to $20,000 and then back to $10,000. The arithmetic average of the annual returns was 25%, but the investor earned nothing over the full period.
The gap comes from the way percentages work on a changing amount of capital. The 100% gain applied to $10,000 and created a $10,000 profit. The 50% loss then applied to $20,000 and erased that entire $10,000. A smaller percentage loss offset a larger percentage gain because it acted on a larger base.
That changing base is the piece a simple average leaves out.
What the arithmetic average actually measures
The arithmetic average is the ordinary average most of us learned in school. You add the periodic returns and divide by the number of periods.
It tells you the average result across those individual periods. In our example, the two observations are +100% and -50%, and their average is +25%.
There are legitimate uses for that number. If we treated those two outcomes as equally likely possibilities for a single future period, the expected one-period return would be 25%. In real investing, estimating expected returns requires far more data and some serious assumptions, but that is the kind of question the arithmetic mean can help answer.
What it does not capture is the compounding that occurred as one period fed into the next. To understand the investor's actual wealth experience, we need to link the returns together.
What the geometric return tells you about wealth
The geometric return expresses the constant annual rate that would have taken the investment from its starting value to its ending value over the same amount of time. You will often see it called the annualized return or compound annual growth rate, usually shortened to CAGR.
The calculation starts by converting each return into a growth factor. A 100% return has a growth factor of 2.00. A 50% loss has a growth factor of 0.50. Multiply them together and you get 1.00:
2.00 × 0.50 = 1.00
Our ending wealth is exactly one times our starting wealth. Across two years, the constant annual growth rate that connects $10,000 to $10,000 is 0%.
This is why geometric return is so useful when you review a realized track record. It respects the fact that each year's return acts on the money left after every year before it.
Why uneven returns create the gap
Now compare that first investment with one that earns 25% in both years.
The second path also has an arithmetic average return of 25%. But $10,000 grows to $12,500 after year one and then to $15,625 after year two. Its geometric return is 25% because the wealth actually compounded at that rate each year.
So we have two investments with the same arithmetic average:
- Investment A earns +100% and -50%, finishing with $10,000.
- Investment B earns +25% and +25%, finishing with $15,625.
The difference is the variation in returns. Compounding rewards consistency because every loss reduces the capital available to participate in the next gain. As returns become more uneven, the geometric return generally falls further below the arithmetic average.
People sometimes call this volatility drag. The name is less important than the mechanism. Your returns multiply across time, and multiplication makes the sequence of gains and losses matter to your wealth.
Which number belongs to which decision
When I see a return figure, I first ask what job the number is supposed to do.
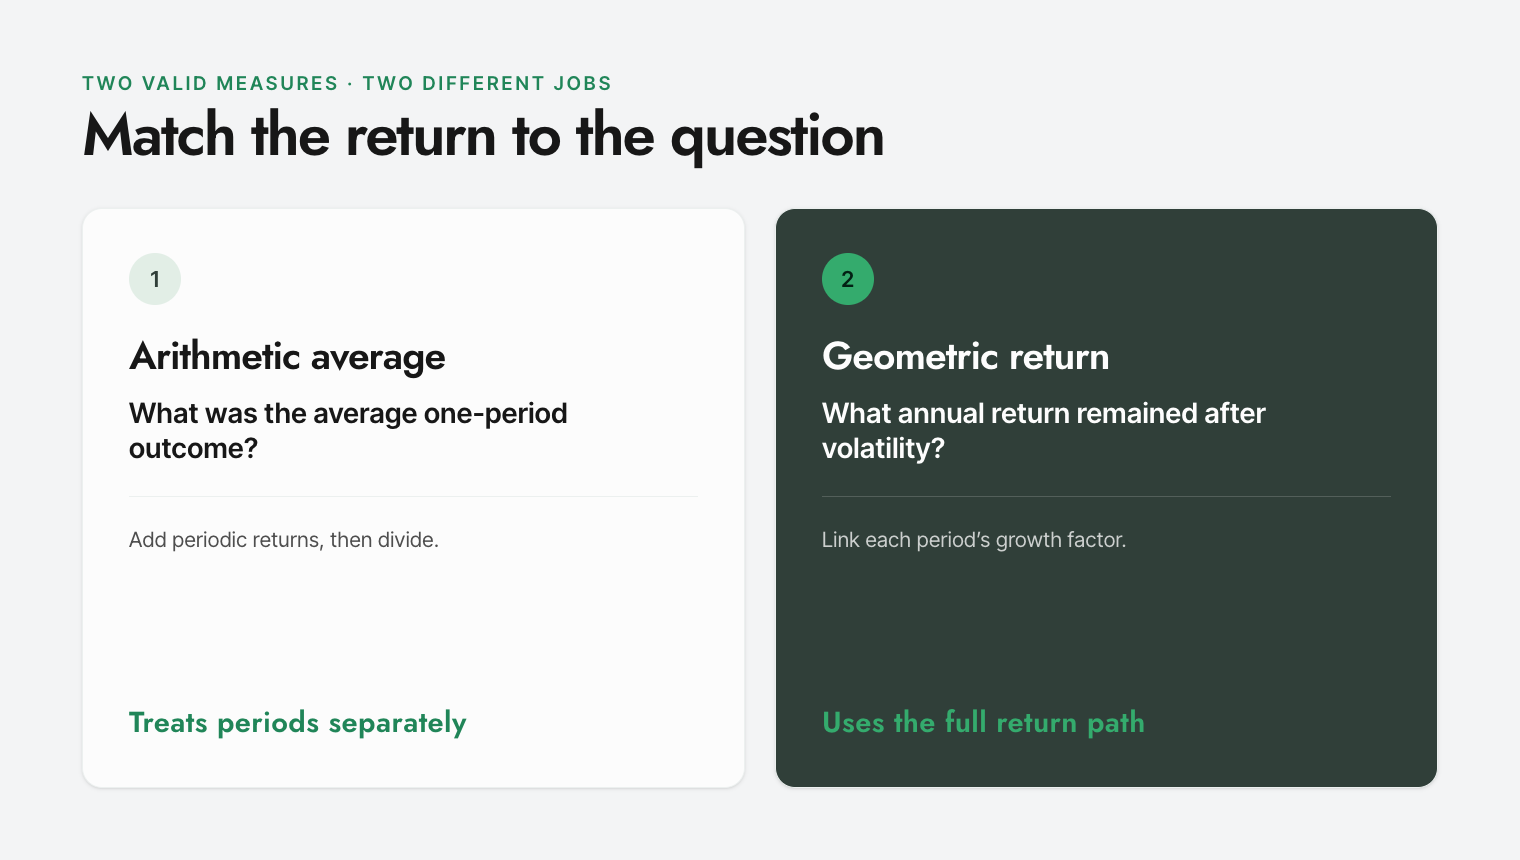
The arithmetic average can be useful when you are estimating an average outcome for one period, provided the data and assumptions make sense. It treats each period as a separate observation.
Geometric return belongs to the question most long-term investors are usually trying to answer: What was the portfolio's average annual return after accounting for the volatility I had to hold through?
If you are evaluating a five-year fund record, a ten-year index return, or the growth of your own portfolio, the annualized geometric return is the relevant measure. It compresses the full multi-period result into one comparable annual rate.
Of course, CAGR does not tell you whether the ride was smooth, when the worst loss occurred, or how difficult the strategy was to hold. You still need to inspect the return path and the risk behind it. But the CAGR will reconcile with the starting value, ending value, and time invested.
Read performance claims without fooling yourself
Whenever you see “average annual return,” slow down before using the number. I would check four things.
First, identify the averaging method. Is the figure an arithmetic average, a geometric annualized return, or something else? If the source does not say, ask.
Second, inspect the full measurement period and, when available, the periodic returns along the way. Two investments can share a CAGR while exposing investors to very different drawdowns. Dates matter too. A conveniently chosen start or end date can change the story.
Third, reconcile the claim with the actual wealth change. In a simple example without deposits or withdrawals, the stated compound return should connect the starting value to the ending value over the stated number of years. Fees, distributions, and external cash flows must be treated consistently.
Fourth, make sure every comparison uses the same convention. Do not compare one fund's arithmetic average with another fund's CAGR.

An average return is not automatically misleading. It may simply answer a narrower question than the one you care about.
When you want to know the average annual return you actually earned after the portfolio's volatility had its effect, ask for the geometric return. That number links the full sequence of returns into one annual rate instead of treating each year as a separate observation.